Accounts receivable key performance indicators (A/R KPIs) give accounts receivable managers a clear view of performance by providing visibility into the efficiency of your invoice-to-cash processes. These insights help businesses improve upon their A/R strategy’s strengths and mitigate its limitations.
To pinpoint areas for improvement and get the data-driven insights you need to refine your accounts receivable procedures, you’ll want to know how to calculate and track these metrics. In this post, you’ll learn about the 9 most truly valuable accounts receivable KPIs, including what they measure and the formulas needed to calculate them. We’ll also include some helpful examples to help illustrate each KPI in the real world.

What are accounts receivable KPIs and what is accounts receivable tracking?
A/R KPIs are performance metrics that provide valuable insight into the efficiency of your business in collecting and managing cash. Tracking these values can offer a clear view into the effectiveness of your debt collection efforts, which directly impacts your company’s liquidity and cash flow.
Accounts receivable tracking, in turn, is the process by which businesses monitor how much cash flow is tied up in unpaid client invoices. Traditionally, most finance professionals track A/R either manually, through a spreadsheet, with accounting software, or using a combination of all three. By monitoring the right KPIs, organizations can gain insight into A/R performance and potential bottlenecks.
Top accounts receivable KPIs
1. Days Sales Outstanding (DSO)
Why is DSO important?
Your days sales outstanding — also known as the average collection period or days receivables — measures how quickly (or slowly) you get paid. The lower your DSO, the sooner you are receiving payments. However, a higher DSO suggests bottlenecks or other inefficiencies in either your payment methods or collections strategy.
In more detail, this metric will tell you how many days it takes on average for a customer to pay you from when the sale is made to when the cash from the sale is received.
DSO formula
Days Sales Outstanding = (Accounts Receivable ÷ Total Credit Sales) x Number of Days
DSO example:
Inconspicuous Inc. is a costume shop that specializes in realistic disguises used by private detectives and law enforcement across the greater Omaha region. Due to increased crime throughout nearby farmland, the local sheriff’s department purchased several Cow-Catcher Surveillance Pods, boosting the retailer’s total sales for the month of February to $143,000. At the same time, the retailer’s total accounts receivable had also ballooned to $223,000.
Wanting to calculate its DSO for February, Inconspicuous applied the formula above:
DSO = ($223,000 ÷ $143,000) x 29 = 45.2 days
This means that on average, the retailer requires 45.2 days to collect payments from its customers after making a sale. Admittedly, this value was higher than the business had hoped, but considering the large sales that had just been closed, Inconspicuous chose to hold off on making any process adjustments until after it had a chance to collect from the sheriff’s department.
2. Average Days Delinquent (ADD)
Why is ADD important?
This metric highlights how many days it takes your business to get paid versus how long it should take. It is useful for accounts receivable professionals looking for ways to identify potential bad debt.
Neglecting to monitor this A/R KPI can lead to high-risk accounts adversely affecting your financial well-being because of unforeseen bad debt and delayed payments. However, by closely monitoring this metric, you can gain better insight into the expected timeframe for high-risk accounts to settle their outstanding payments.
Average days delinquent formula
Average Days Delinquent = Days Sales Outstanding – Best Possible Days Sales Outstanding
To calculate your best possible days sales outstanding (BPDSO), you only focus on your current accounts receivable, ignoring any past-due invoices:
BPDSO = (Current Accounts Receivable ÷ Total Credit Sales) x Number of Days
Average days delinquent example
In the DSO example above, Inconspicuous Inc. netted a DSO of 45.2 days in the month of February. However, by excluding its past-due invoices, the business calculated that its current A/R was $183,000, making its best possible DSO value 37.1 days. So for this month, its ADD calculation yielded:
ADD = 45.2 days – 37.1 days = 8.1 days
Therefore, it takes on average 8.1 days beyond the due date for its customers to settle their invoices.
3. Collections Effectiveness Index (CEI)
Why is CEI important?
The collections effectiveness index tracks how efficiently you collect payments from your customers, essentially measuring the percentage of your accounts receivable that you collect over a given time period. It’s an important metric to track because it allows you to more easily determine how much of your money is lost to bad debts.
CEI formula
|
Collections Effectiveness Index |
= |
Beginning A/R + Monthly Credit Sales – Total Ending A/R |
x |
100 |
|
Beginning A/R + Monthly Credit Sales – Current Ending A/R |
CEI example
Returning to Inconspicuous Inc.’s successful February, we already know that the business netted a total A/R of $223,000, a current A/R of $183,00, and total sales for the month at $143,000. Further, after looking over its financial records, the business established that its total A/R for the beginning of the month equaled $137,000.
CEI = (($137,000 + $143,000 – $223,000) ÷ ($137,000 + $143,0000 – $183,000)) x 100 = 58.8%
Ideally, a CEI of 80% or above is considered “good” and suggests better collections performance. If your team struggles with collections effectiveness, as evidenced by a low CEI, it may be necessary to enhance your invoice tracking processes to prevent payment delays. Consider adopting an automated accounts receivables system to ensure timely invoicing and payment follow-up.
4. Accounts Receivable Turnover (ART)
Why is the accounts receivable turnover ratio important?
Unlike CEI or DSO, the accounts receivable turnover ratio doesn’t just indicate how long it takes to get paid but establishes a company’s effectiveness in collecting payments and turning that money into cash.
A higher ART is preferable, as it indicates that your A/R team is collecting on outstanding invoices quickly, yielding better cash flow. However if you have a low ART, you’ll need to bolster your collections efforts. Offering incentives like early payment discounts is one strategy to have customers make payments sooner.
Accounts receivable turnover formula
Accounts Receivable Turnover = Net Credit Sales ÷ Average Accounts Receivable
Accounts receivable turnover example
ART is typically used to monitor annual performance, So as Inconspicuous reviews its financials from 2023, it notes that it completed $1,658,000 in net credit sales while maintaining an average accounts receivable balance of $148,000.
ART = $1,658,000 ÷ $1,500,000 = 11.2
Therefore, the retailer collected its receivables – meaning it converted them to cash–11.2 times the preceding year.
5. Bad debt-to-sales ratio
Why is measuring bad debt important?
Also called the write-off ratio, this A/R metric estimates the portion of unpaid invoices that you will not be able to collect on and that will be subsequently designated as bad debt. Depending on the size of this ratio, you may want to instruct your A/R team to more closely monitor the extension of credit to customers.
Bad debt formula
Bad Debt to Sales Ratio = (Bad Debt ÷ Total Sales) x 100
Bad debt example
Returning to its February financials and wanting to determine its bad debt-to-sales ratio, Inconspicuous noted that while it recorded $143,000 in total sales, it also wrote off $20,000 in bad debt.
Bad Debt to Sales Ratio = ($20,000 ÷ $143,000) x 100 = 13.9%
Generally, a bad debt-to-sales ratio under 15% is considered good, indicating effective management of credit and collections. Conversely, a ratio above 25% should raise concerns about credit control procedures and potential financial risk.
6. Operational cost per collection
Why is operational cost per collection important?
Want to examine the average amount your business is spending – including on employee time, postage, and other expenses – to collect on each invoice? Check out your operational cost per collection. The lower the value, the better your bottom line. Of course, the more invoices you have, the more your operational costs will also inflate.
Operational cost per collection formula
Operational Cost Per Collection = A/R-Related Expenses ÷ # of Completed Collections
Operational cost per collection example
Each month, Inconspicuous spends roughly $2,000 in technology costs and $3,000 in salary for its A/R efforts. In February 2024, the retailer coordinated with Knee-Capper Collections to recover some of its delinquent accounts. In total, KCC closed out $30,000 worth of invoices, keeping $4,800 as its commission. So over the course of the month, Inconspicuous spent $9,800 on its total A/R efforts. And during that same time period, the business closed out 172 invoices.
Operational Cost Per Collection = $30,000 ÷ 172 invoices = $174.42 per invoice
You ideally want this number to be as low as possible. The best way to lower your operational cost is to invest in accounts receivable automation software, which helps your AR team automate tasks such as payment reminders, customer statements, and more – so they can better focus on strategic responsibilities.
7. Right party contracted (RPC) rate
Why is the right party contracted rate important?
Are you unsure if you’re reaching the right people when sending invoices? The RPC calculates the percentage of your payment communications that go to the right contact.
A high RPC rate is ideal as it means you’re contacting the correct targets. A low RPC rate, on the other hand, suggests you may not be targeting the right people or collecting the right information during the onboarding process.
Right-party contracted rate formula
RPC = (# of Right Contacts ÷ # of Contacts Attempted) x 100
Right party contracted rate example
As part of its dunning efforts, Inconspicuous contacted 128 of its clients over a month, requesting payment. However, 16 of these notices were sent to an incorrect address due to transcription errors. In this case, the right-party contact rate would be 87.5%.
RPC Rate = (112 contacts ÷ 128 contacts) x 100 = 87.5%
8. Days Deduction Outstanding (DDO)
Why is DDO important?
Despite your best efforts, sometimes the invoices you send clients contain errors. When clients dispute your calculated totals, you’ll need to investigate, verify, and recalculate these payment requests – efforts that take some time. DDO lets you track the average time you spend resolving these disputes.
Deduction days outstanding formula
DDO = Amount of Open Deductions ÷ (Average Value of Deductions x # of days)
Days deduction outstanding example
February is often a busy month for Inconspicuous, as a lot of undercover work happens surrounding Mardi Gras. In the weeks leading up to the occasion, many one-off customers from across the country purchase bead—and boa-based surveillance accessories. Many buyers take advantage of the retailer’s early payment discount to keep these sophisticated devices budget-friendly.
Wanting to gain a snapshot of its recent DDO, Inconspicuous evaluated the four weeks leading up to Mardi Gras. It identified that the total value of open deductions it had in place was $12,000. Meanwhile, in that same 28-day period, the average daily value of these deductions was $800.
DDO = $12,000 ÷ $800 = 15 days
A lower DDO is desirable because open deductions are resolved in an ideal time frame.
9. Number of revised invoices
Why is the number of revised invoices important?
The number of revised invoices refers to the number of invoices your A/R team has needed to revise in a specific period. Tracking the number of invoices that require revisions can help finance teams identify issues with the invoicing process.
Suppose you find your team constantly needing to update or adjust invoices. In that case, you may be experiencing issues related to inaccurate credit terms or errors from manual data entry–which can be readily resolved by implementing A/R automation software.
How to track the number of revised invoices
Rather than calculating values according to a given formula to track the number of revised invoices and their impact on your collections process, you instead review the:
- Average time spent resolving disputes (factoring in both the work hours spent and the average number of revised invoices generated due to disputes)
- Average time spent creating revised invoices
- Average time for delivery of revised invoices (which is only relevant if you use traditional mail or other non-instant communication methods)
Add up all of the above to obtain a cumulative number of days. Then, add this value to your average collection period to predict when a payment will be received following the reissue of a given invoice.
How accounts receivable automation software can make meeting your KPIs a breeze
Altogether, if you want to ensure that your A/R operations are running smoothly and consistently, you’ll need to track many details. If you try to do so by hand, you’ll quickly become overwhelmed. Not only will your workers need to monitor multiple data feeds, but they also continuously run the underlying calculations for critical KPIs to make sense of that information.
Conversely, with an automated platform, you can:
- Accelerate invoicing processes
- Reduce potential transcription errors
- Eliminate unnecessary wait times
- Free up staff for more strategic tasks
- Enable more nuanced control of cash flow
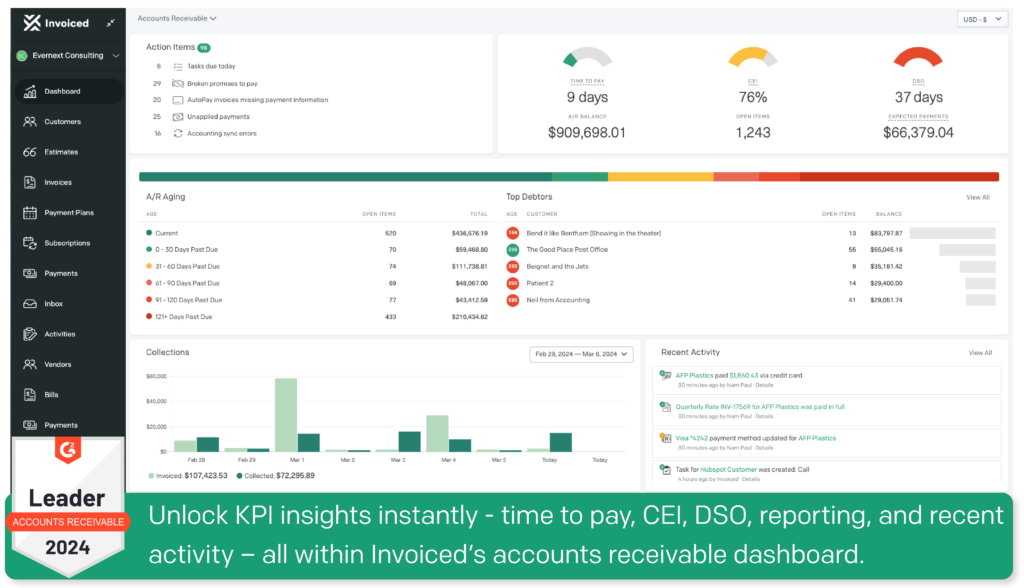
Of course, the success of these efforts will heavily rely on which platform you choose. Our Accounts Receivable Automation software can show you where you stand at a glance. From pre-built reports to customizable KPI dashboards that track hundreds of objects and fields – you can identify, capture, and store critical insights that will let you more easily isolate problem areas and process bottlenecks.
Even better, our software supports multi-entry filtering for reports, which allows you to parse out performance figures from enterprise-wide stats to isolate what is and isn’t working by individual business units, regions, or teams. With these up-to-date statistics, our embedded analytics tools can provide more accurate cash collection forecasts, letting you strategically leverage your current and impending cash flow.
Simplify accounts receivable KPI tracking with Invoiced
Tracking these accounts receivable KPIs helps you measure the performance of your A/R team and gives you the insight you need to improve cash flow.
Choose Invoiced’s Accounts Receivable Automation software to transform your A/R operations. It minimizes human errors from manual data entry and captures real-time insights, allowing your team to reclaim valuable time and concentrate on more strategic tasks.
If you’re ready to streamline your financial processes, schedule a demo today to learn how we can propel your business forward.